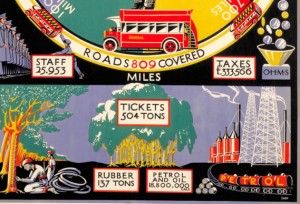
Infographics Goes Retro
 The growing trend in infographics, due in part to the rise of the Internet and social marketing, has a historical component going back to the Egyptian’s astronomical tables of the 2nd century. Jump to the 1920s London, and data visualization is being used to regale the London Underground, enticing the erstwhile passenger to ride the Tube. Fast forward to the 21st century, where today’s buzzword encompasses the data-as-art phenomenon with modern-day information design gurus such as Edward Tufte to emblazon the way. Tufte’s vision of information graphics rests in creating order out of chaos, making sense out of the evidence, ascribing the multidimensional, dynamic world of information onto a static, flat surface.
2-D Captivity: A Prison Break
Escaping this “flatland,” a reference to Flatland, a 19th century book where two-dimensional life is the norm, is Tufte’s oft-used metaphor for the challenge faced when attempting to create an appealing and arresting presentation, whether it be for a company website, brand advertising, non-profit fundraising, or simply to promote corporate responsibility. In his books, Tufte documented what he believes are some of the best graphic illustrations, and include an 1869 map of Napoleon’s 1812 invasion of Russia and the failure of the 1986 Space Shuttle Challenger launch.
Rich content, layers of detail, while maintaining simplicity and ease of navigation, are key elements in designing a successful infographic. Avoid what the “da Vinci of data” calls “chartjunk,” anything in the realm of graphic design that detracts from its informative function by diverting readers with needless ornamentation. Whereas he concedes there is such a thing as too much data – a recent estimate for the size of the Internet indicated over 5 billion gigabytes – Tufte does not believe in informational overload. Neither does the KISS principle (Keep It Simple Stupid) carry much weight with him; assume your audience is as smart as you are. Everything should be made as simple as possible, but not simpler, as Einstein reportedly said.
Infographics This
 For a view of the varied infographics ascending the World Wide Web’s horizon, meander through the strange beauty of an artistic rendering of the history of the sci-fi genre. Learn how to use Google search more effectively; while geared toward the college student, its tips will benefit everyone. Participate in World Water Day 2012 and help raise funds and raise awareness through Facebook sharing (hurry, ends March 30!). And for some me time, Intel’s “What About Me” will create a social media profile in a flower-motif infographic. Beware of the “socially disruptive” narcissist!
We are in an age where information demands to be not simply read, but acutely seen. Our visual world has never been more stimulating in its two-dimensional form. Think video screen, computer monitor, or piece of paper. Add information, inspiration, and really thoughtful graphic design. The sky’s the limit, or, rather, the surface is.